
D3
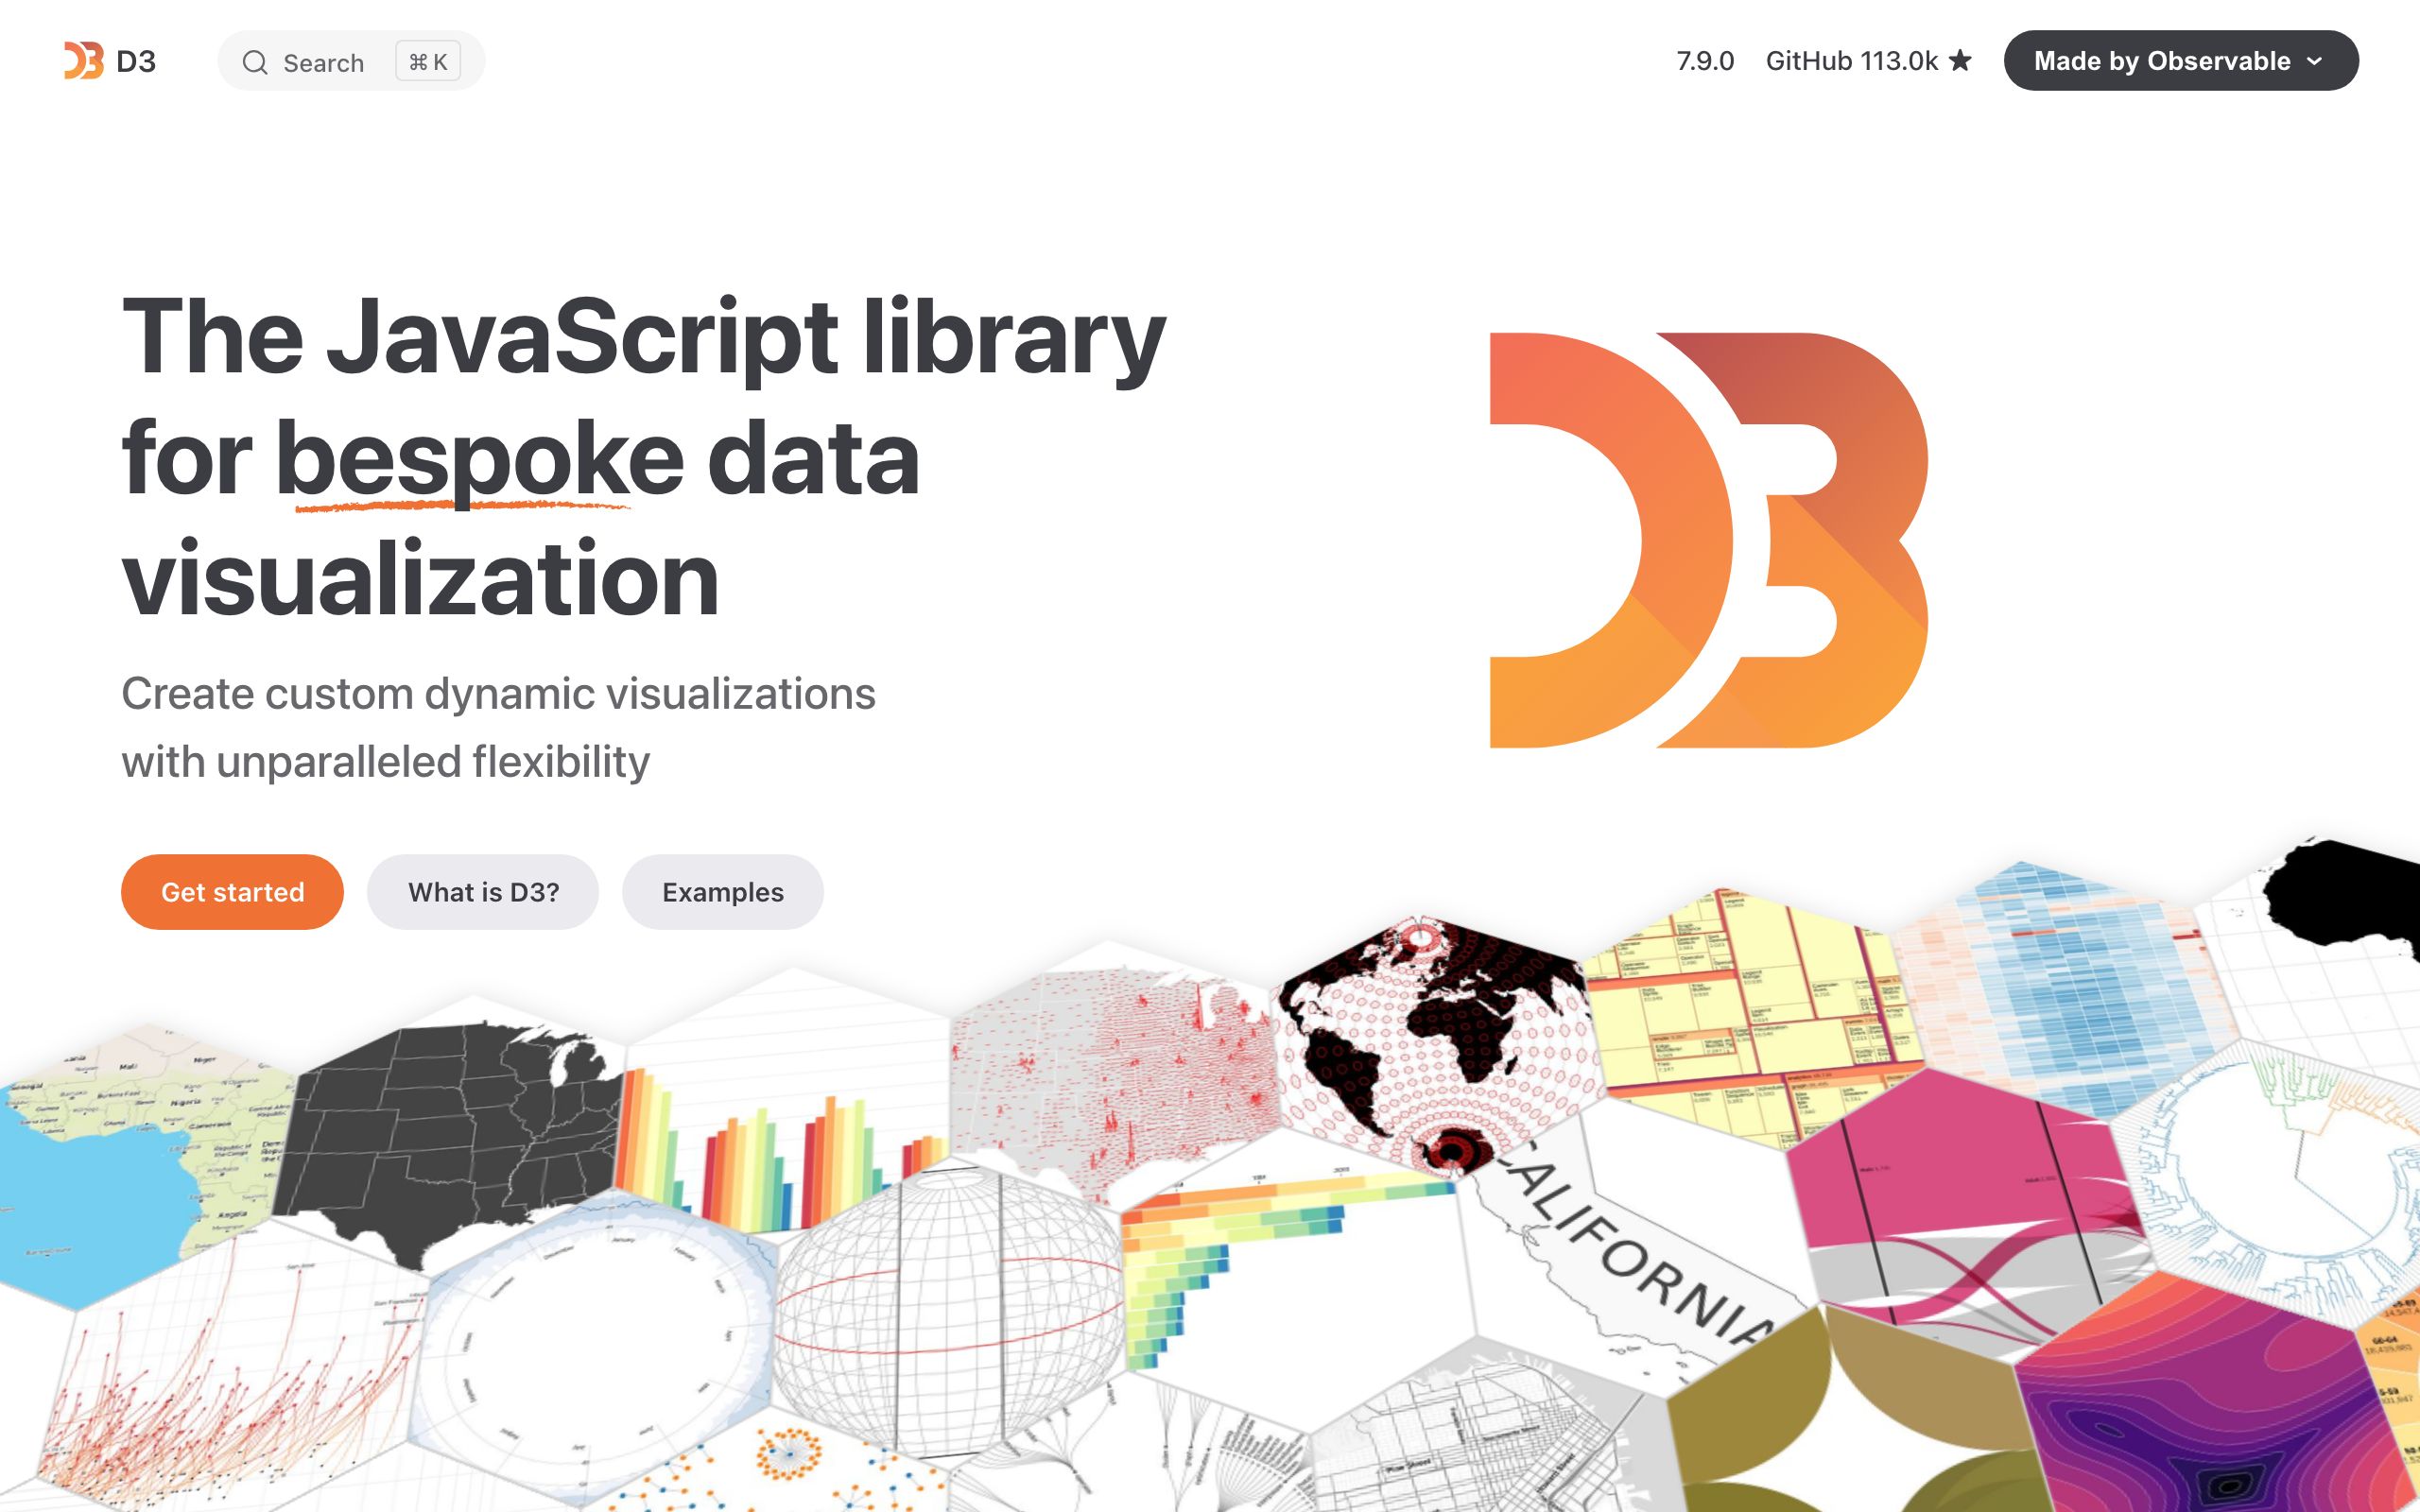
D3 is a powerful JavaScript library for producing dynamic, interactive data visualizations in web browsers. It utilizes SVG, HTML5, and CSS to bring data to life. By binding arbitrary data to a Document Object Model (DOM), D3 allows developers to apply data-driven transformations to the document. It provides a comprehensive suite of tools for scales, axes, shapes, layouts, and geographic projections, offering unparalleled flexibility for bespoke visualization needs.
Checked on Oct 19, 2026.
Alternative resources

Kroki
Unified HTTP API to generate diagrams from textual descriptions supporting multiple diagram libraries and output formats.

Chart.js
A flexible JavaScript charting library for the web that uses HTML5 Canvas for rendering and supports eight different chart types.

Mermaid
An open-source diagramming and charting library that uses text-based definitions and a live editor to render diagrams dynamically.