
Dygraphs
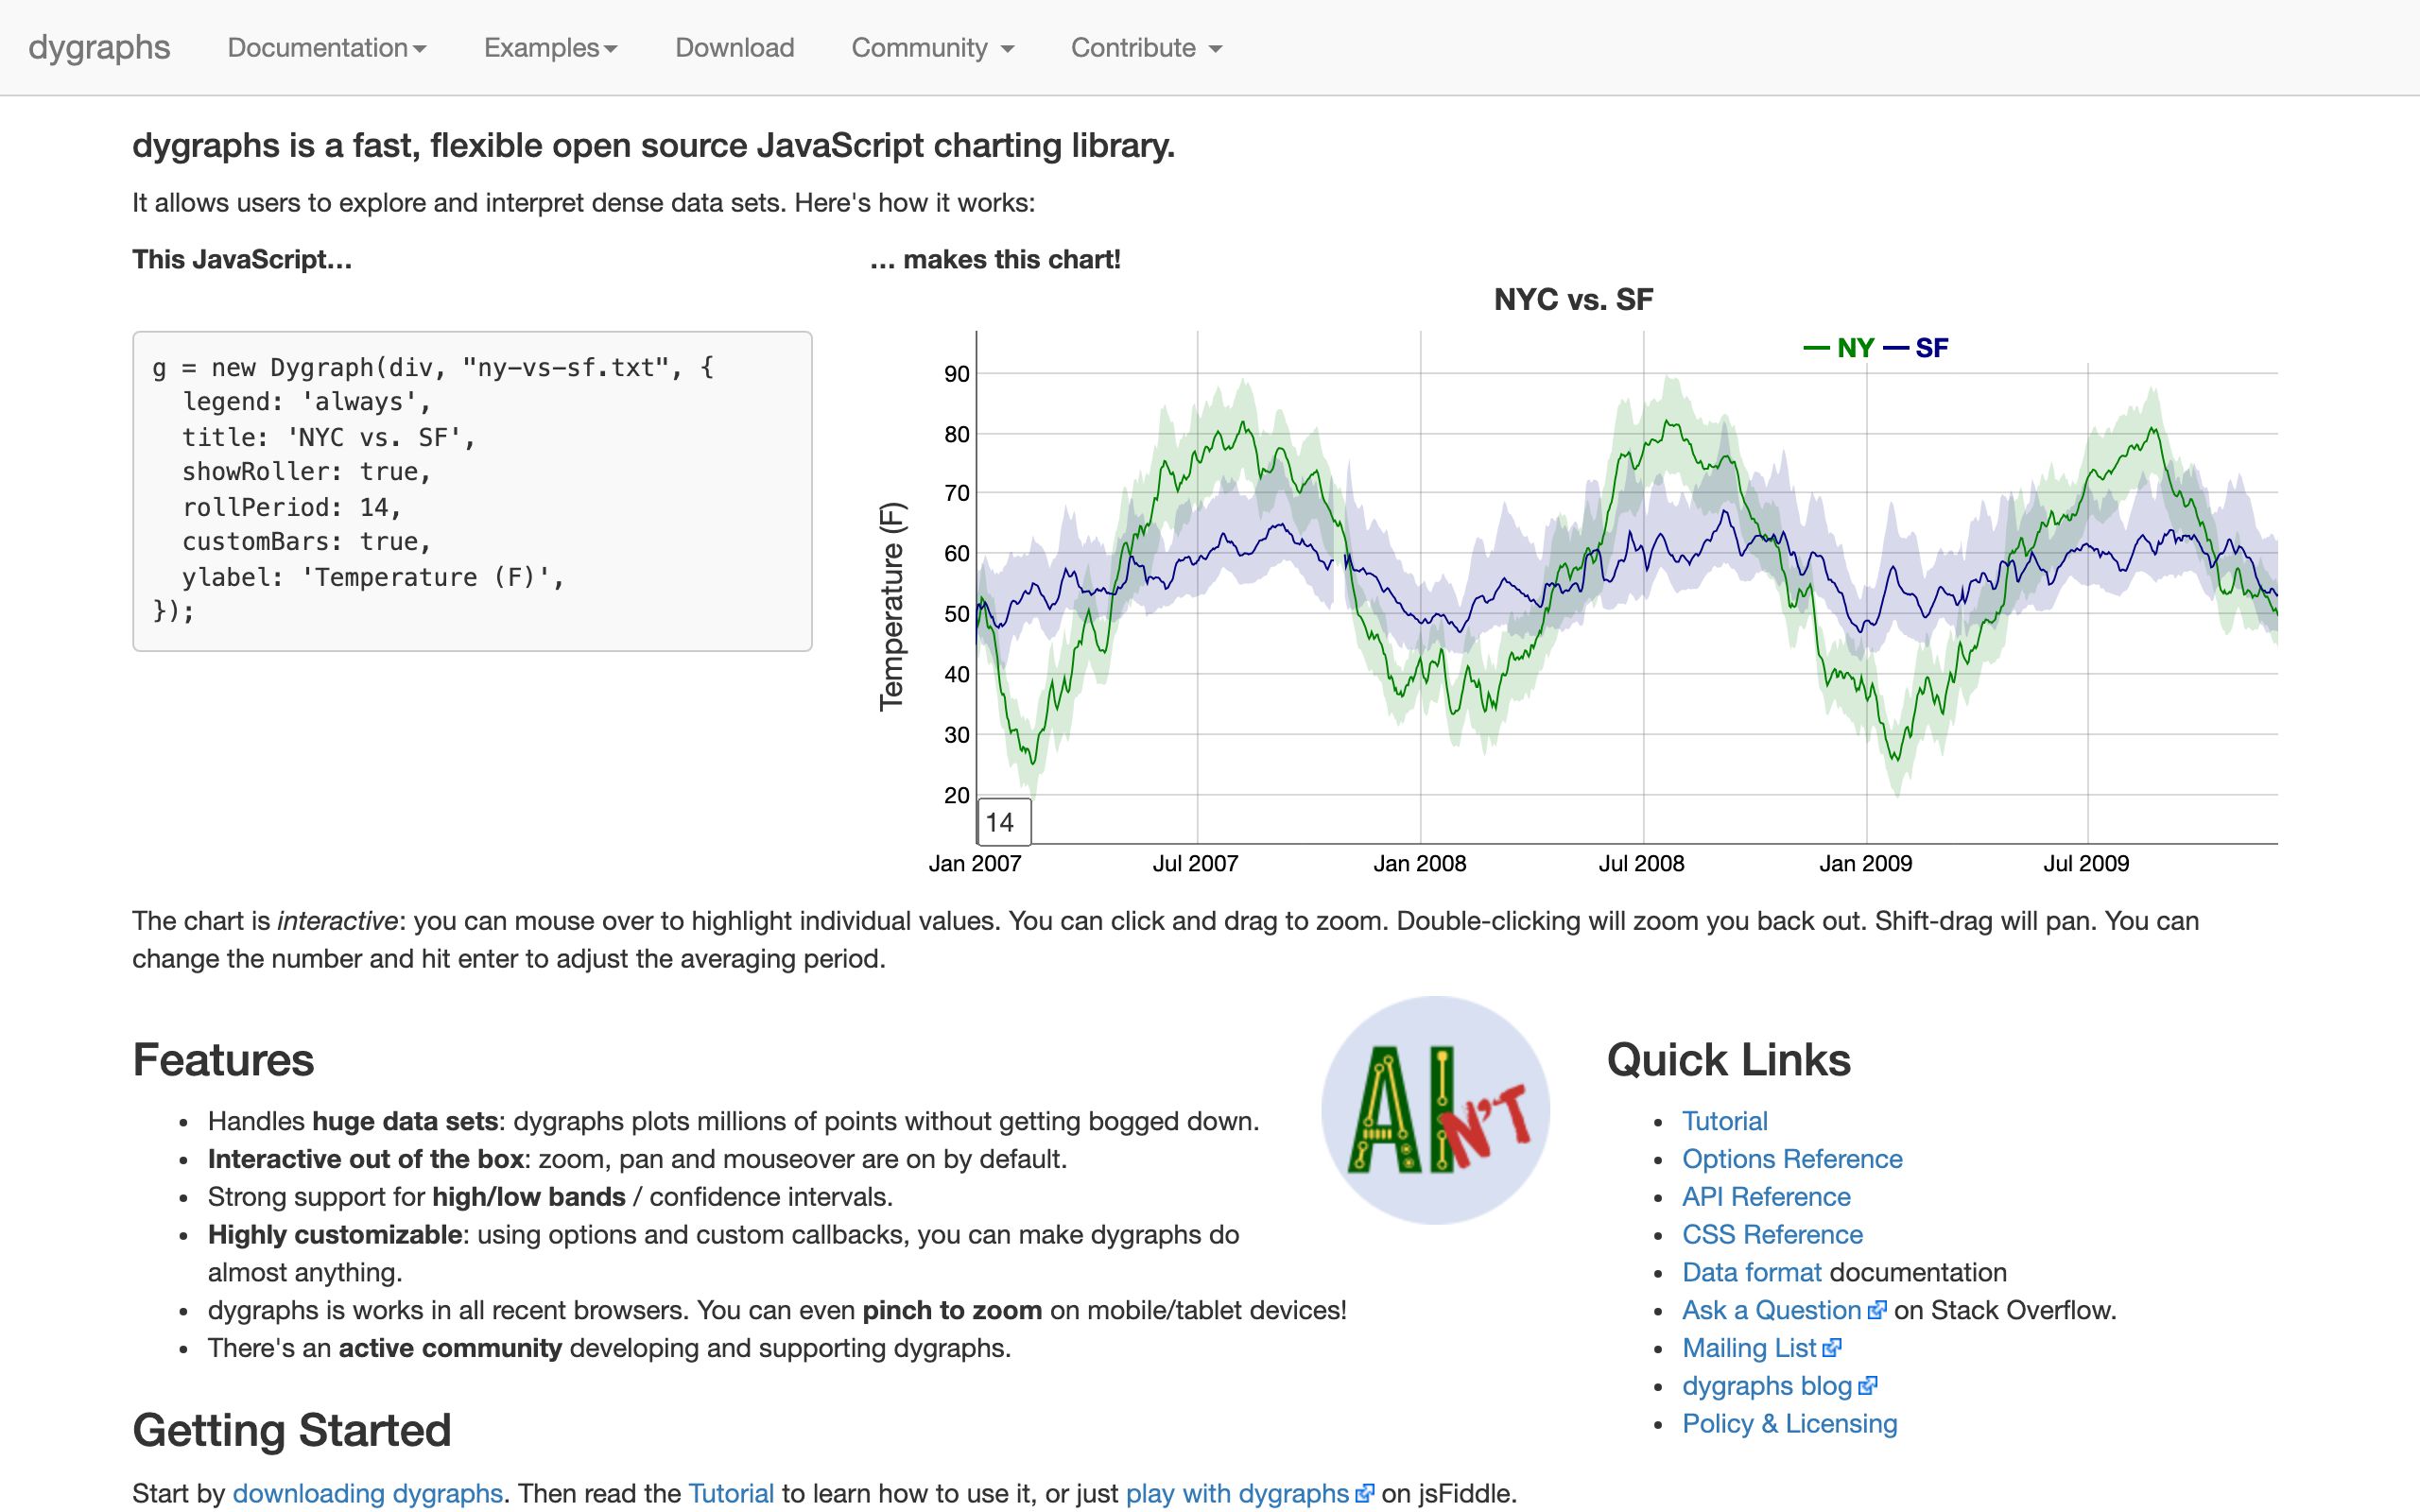
Dygraphs is an open source JavaScript library built to handle and visualize massive data sets efficiently. It provides interactive charting capabilities out of the box, including zooming, panning, and mouseover highlighting. The library supports high/low bands and confidence intervals, making it suitable for complex data analysis. It is highly customizable through options and callbacks and is compatible with all modern browsers, including mobile touch support.
Checked on Oct 19, 2026.
Alternative resources

Kroki
Unified HTTP API to generate diagrams from textual descriptions supporting multiple diagram libraries and output formats.

Chart.js
A flexible JavaScript charting library for the web that uses HTML5 Canvas for rendering and supports eight different chart types.

Mermaid
An open-source diagramming and charting library that uses text-based definitions and a live editor to render diagrams dynamically.