
Grafana Labs
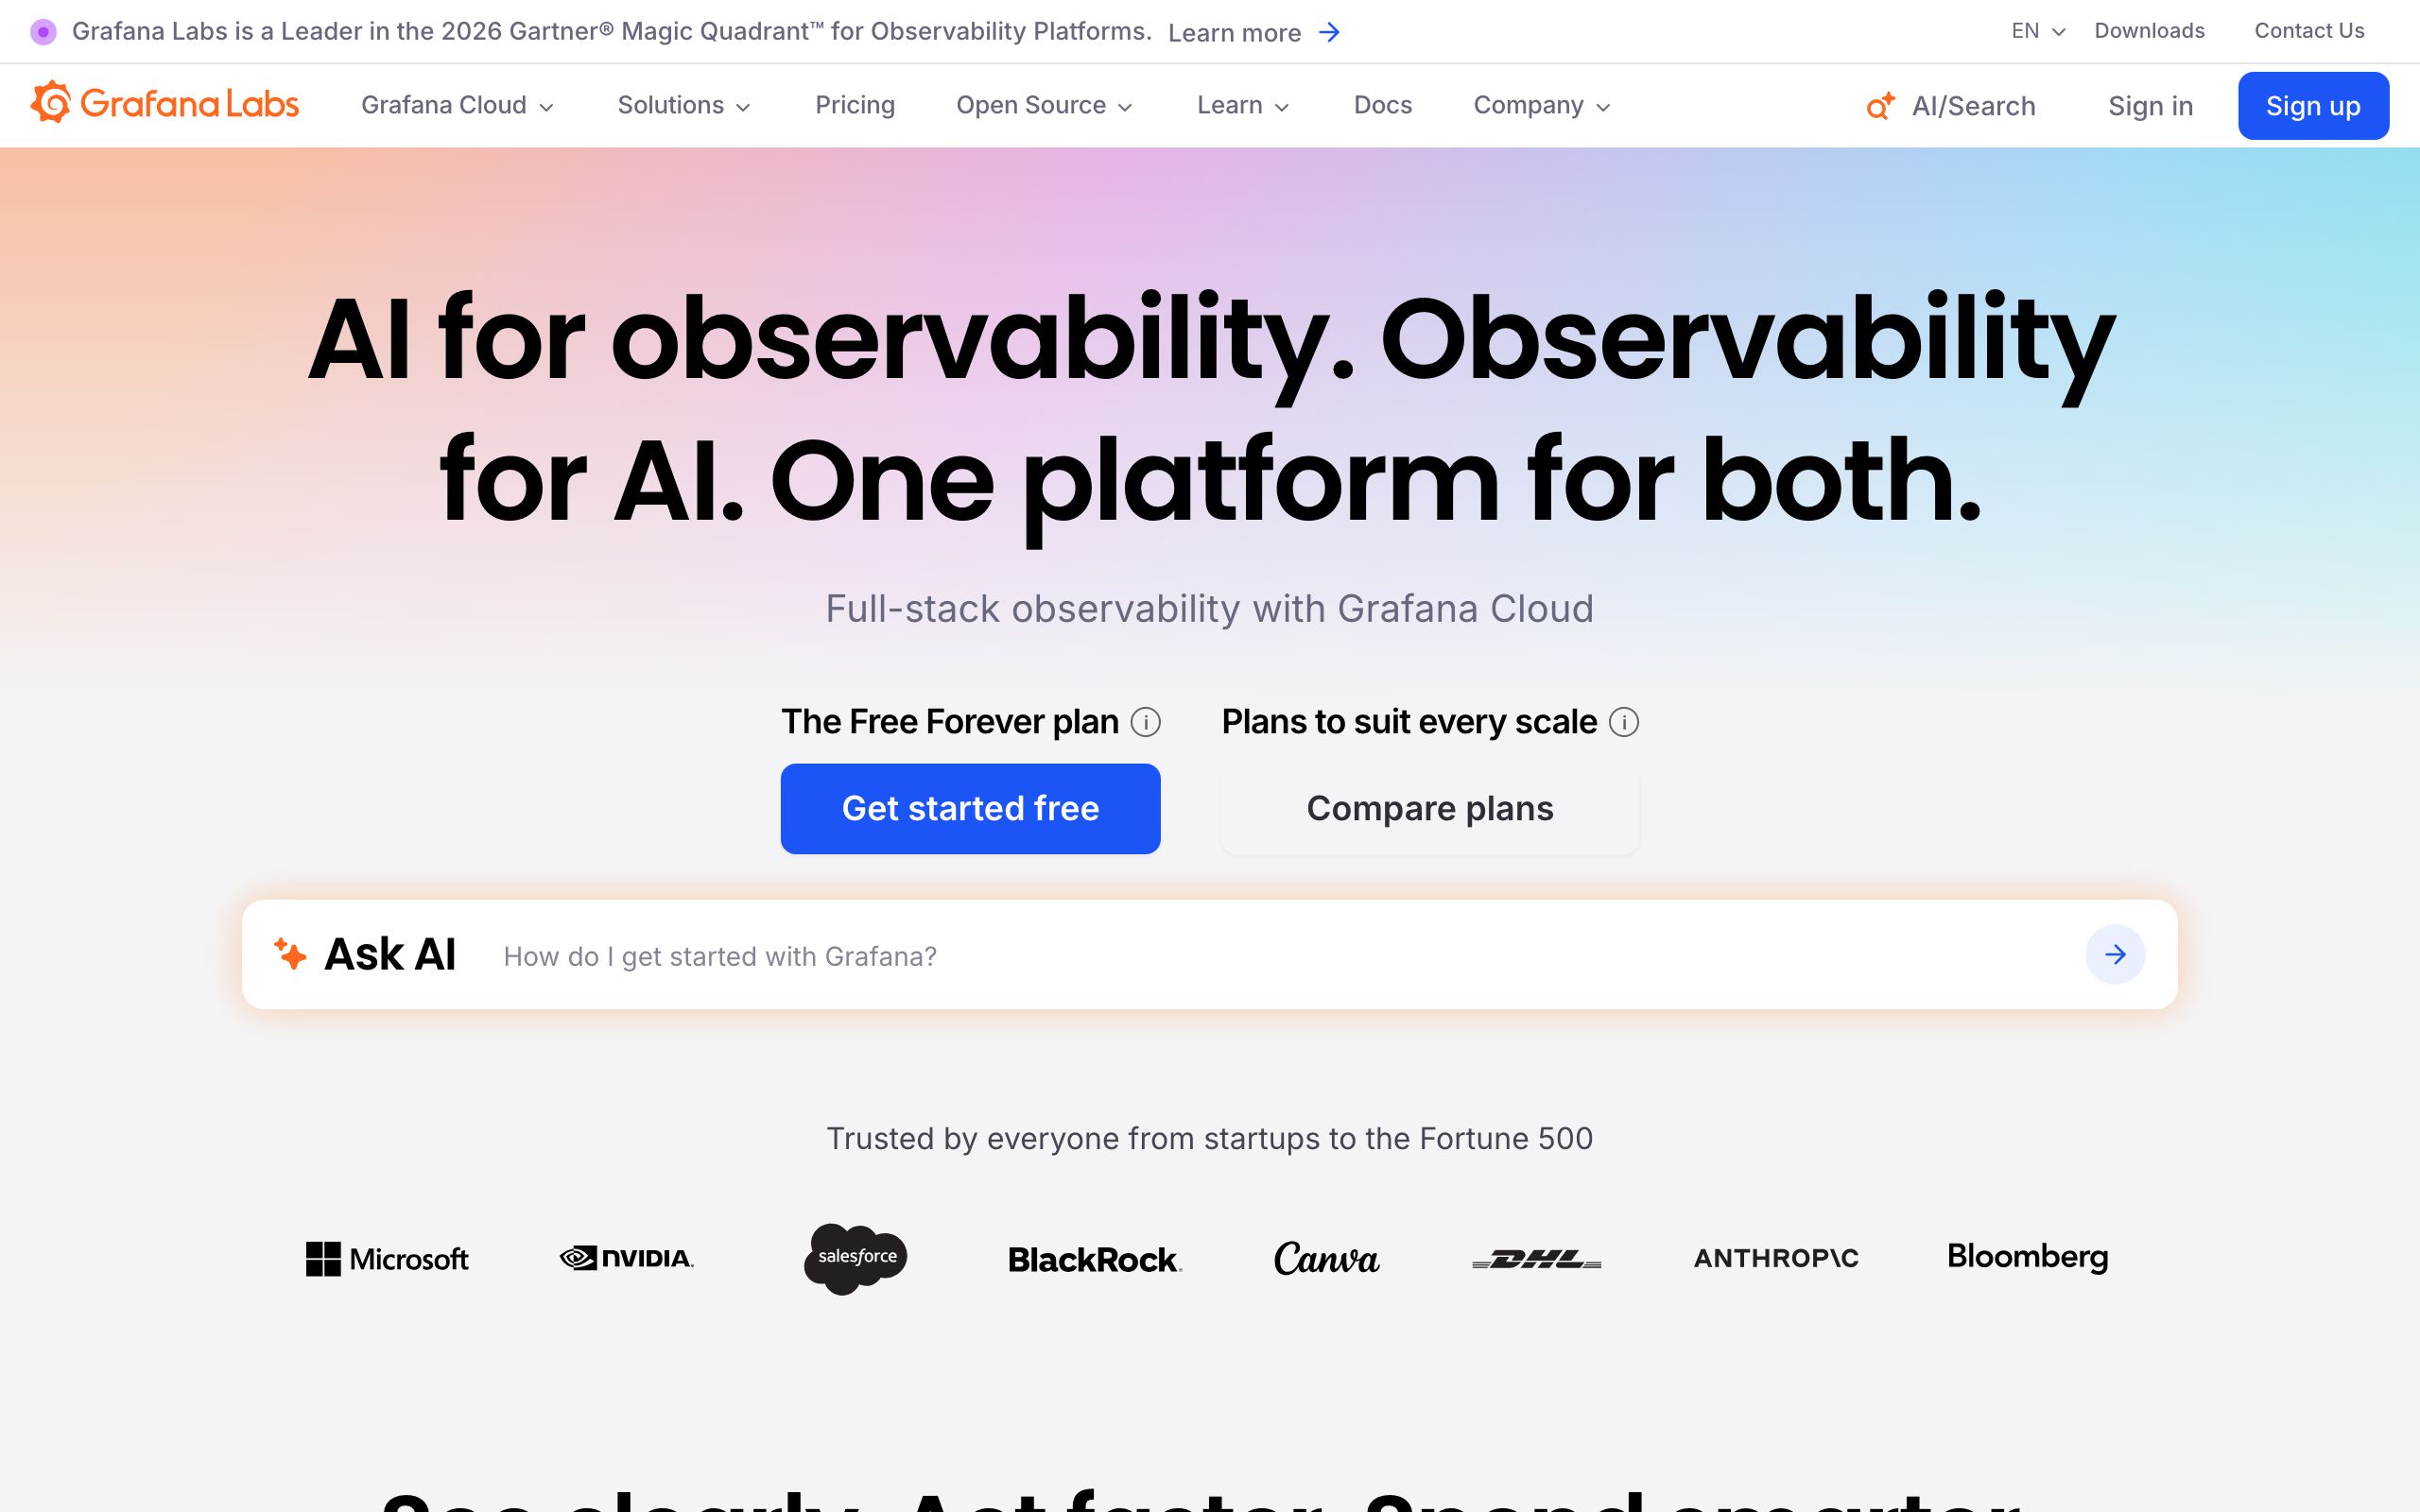
Grafana Labs provides an open and scalable observability platform designed to collect, analyze, and visualize telemetry signals including logs, metrics, traces, and profiles. Built on open standards like OpenTelemetry and Prometheus, the platform integrates multiple data sources into a unified interface. It features incident response management, synthetic monitoring, performance testing, and AI-powered operational assistants to streamline root cause analysis and reduce data storage costs.
Checked on Sep 30, 2026.
Alternative resources

Zuzia
All-in-one server monitoring panel for freelancers and small agencies. Track uptime, SSL, ports, DNS, and server metrics without complex setups.

SigNoz
Open-source APM and observability platform for logs, metrics, and traces, built on OpenTelemetry and ClickHouse.

Lighthouse
Automated open-source tool for improving the quality of web pages with audits for performance, accessibility, SEO, and progressive web apps.