
Highcharts
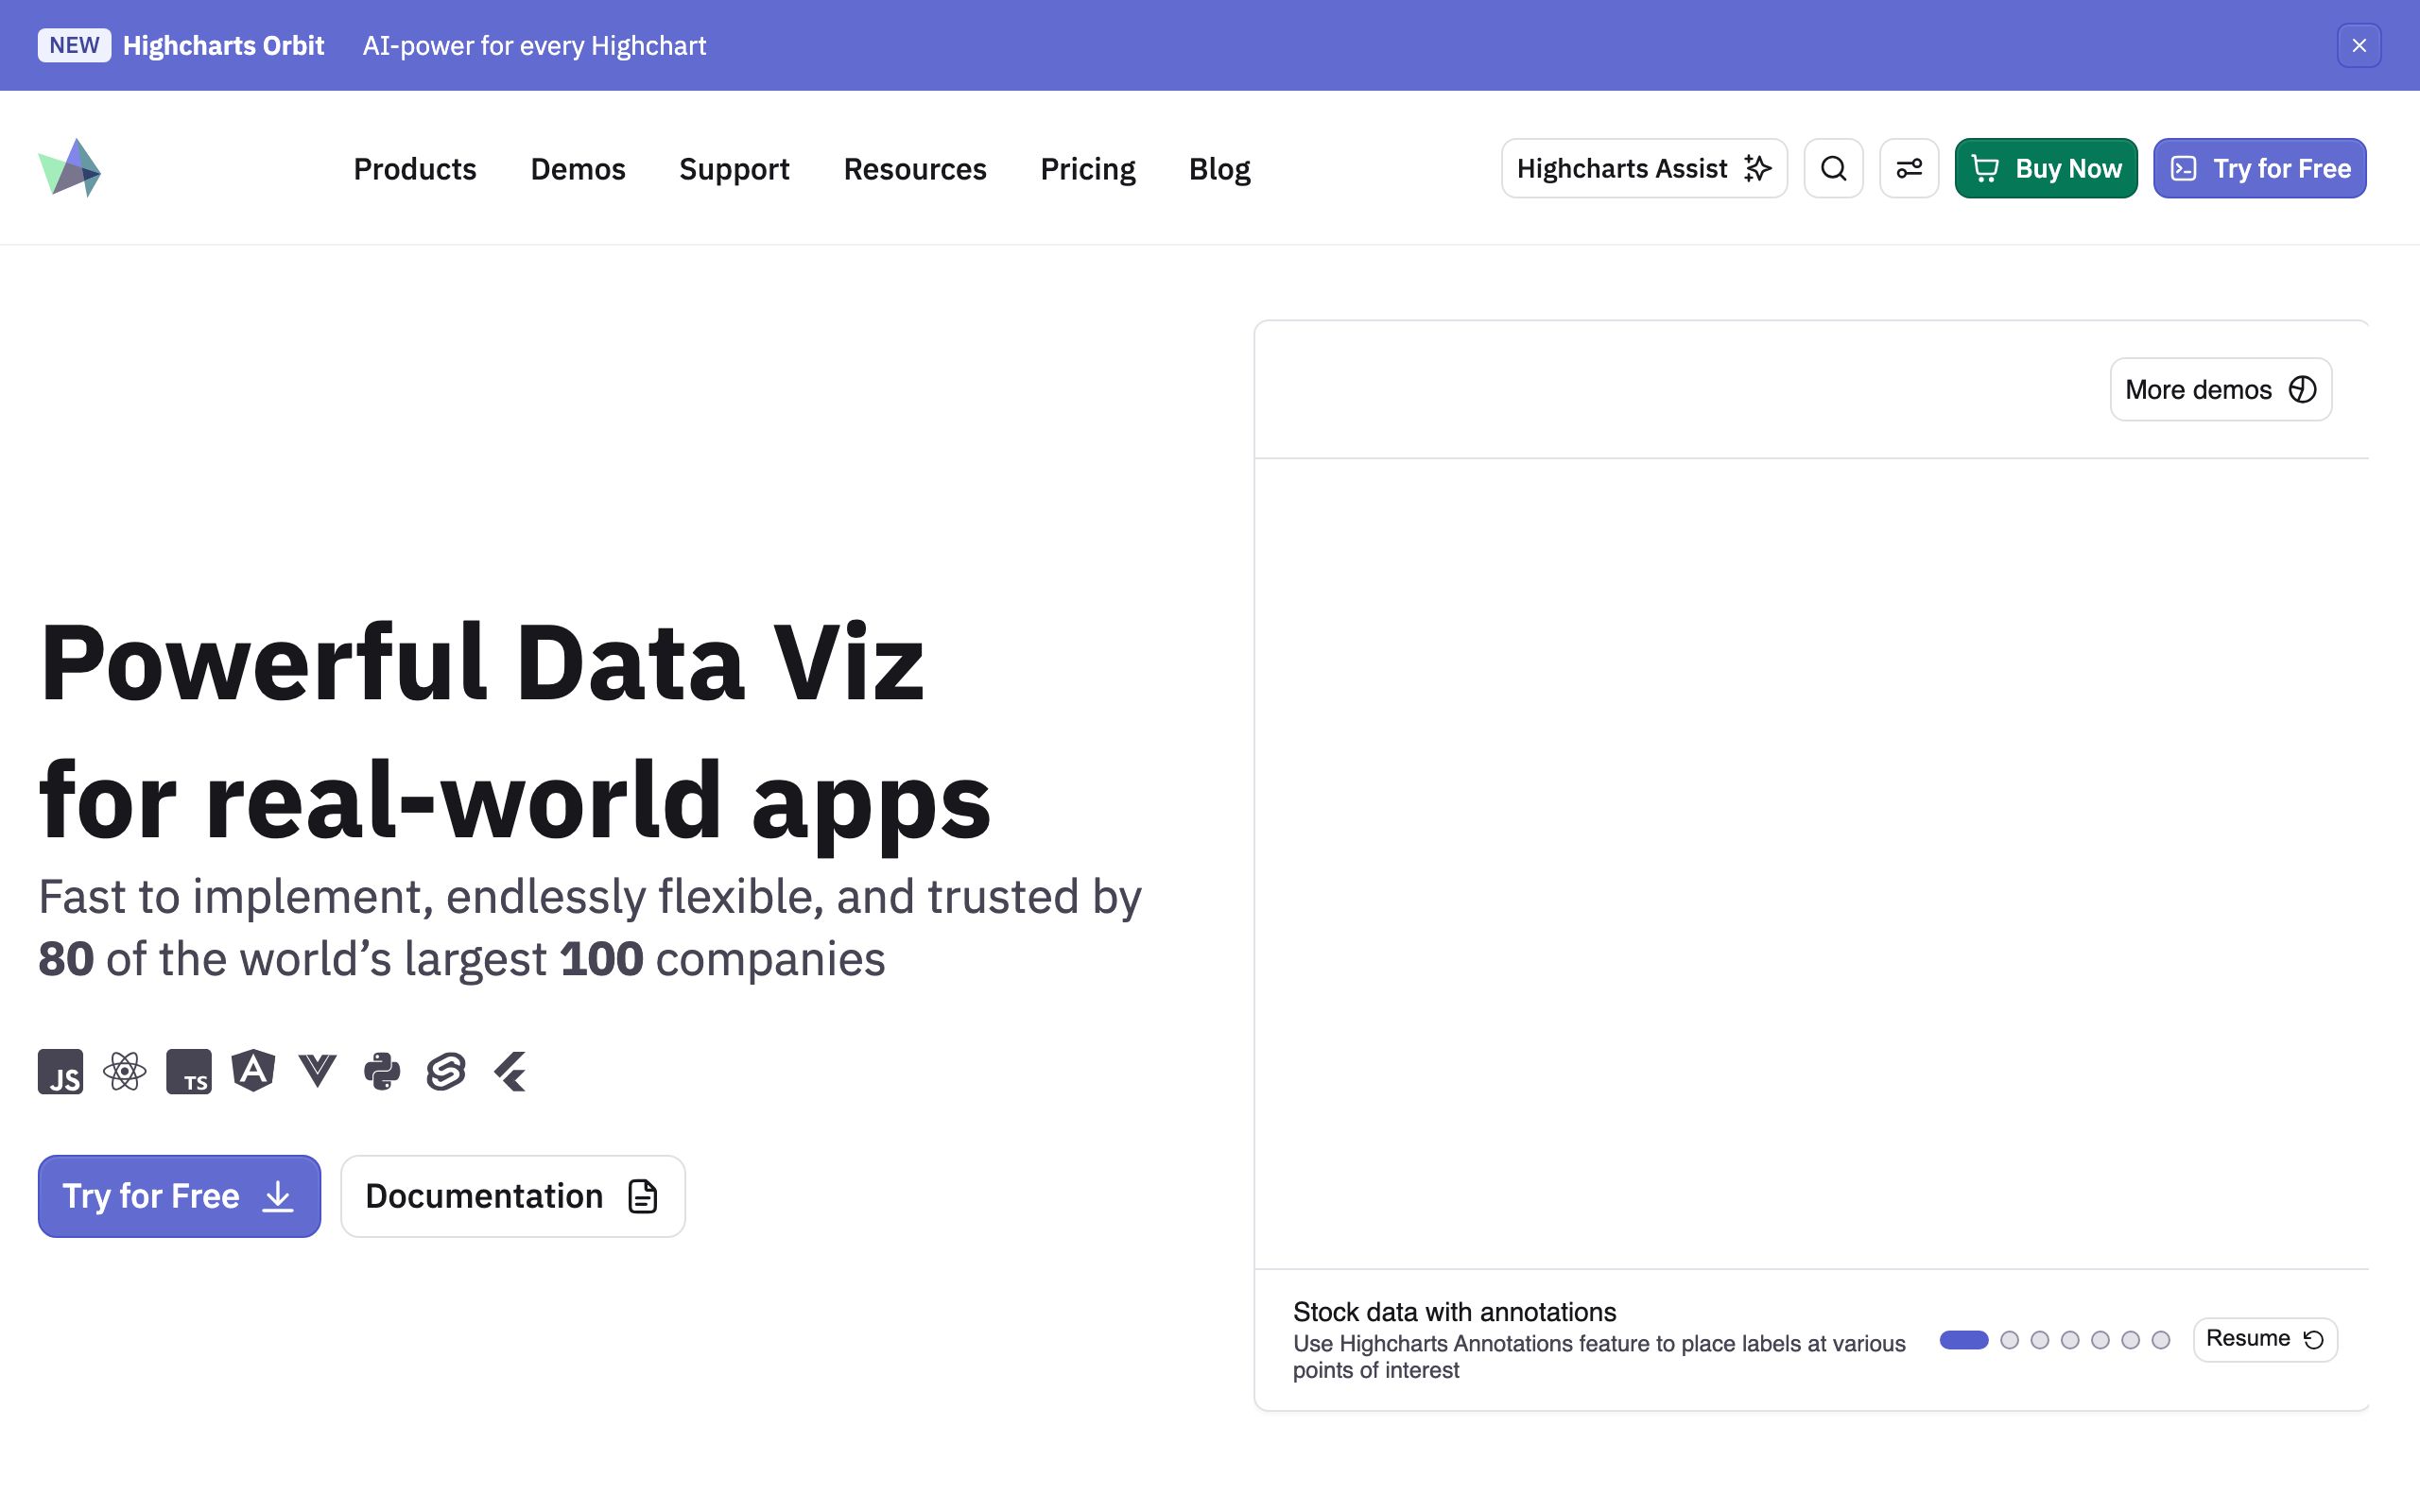
Highcharts is a robust, industry-standard data visualization library that enables developers to build complex, interactive charts and dashboards. It supports a wide range of chart types, including stock, maps, and Gantt, with built-in accessibility features and intelligent responsiveness. The library is framework-agnostic, offering official integrations for React, Angular, Vue, Svelte, and Python, and includes advanced tools for forecasting, anomaly detection, and AI-powered data insights.
Checked on Oct 19, 2026.
Alternative resources

Bricks
AI-powered data analysis and visualization platform for creating interactive dashboards, reports, and spreadsheets from various data sources.

CanvasJS
A high-performance HTML5 JavaScript charting library supporting over 30 chart types for responsive web dashboards.

Kroki
Unified HTTP API to generate diagrams from textual descriptions supporting multiple diagram libraries and output formats.