morris.js
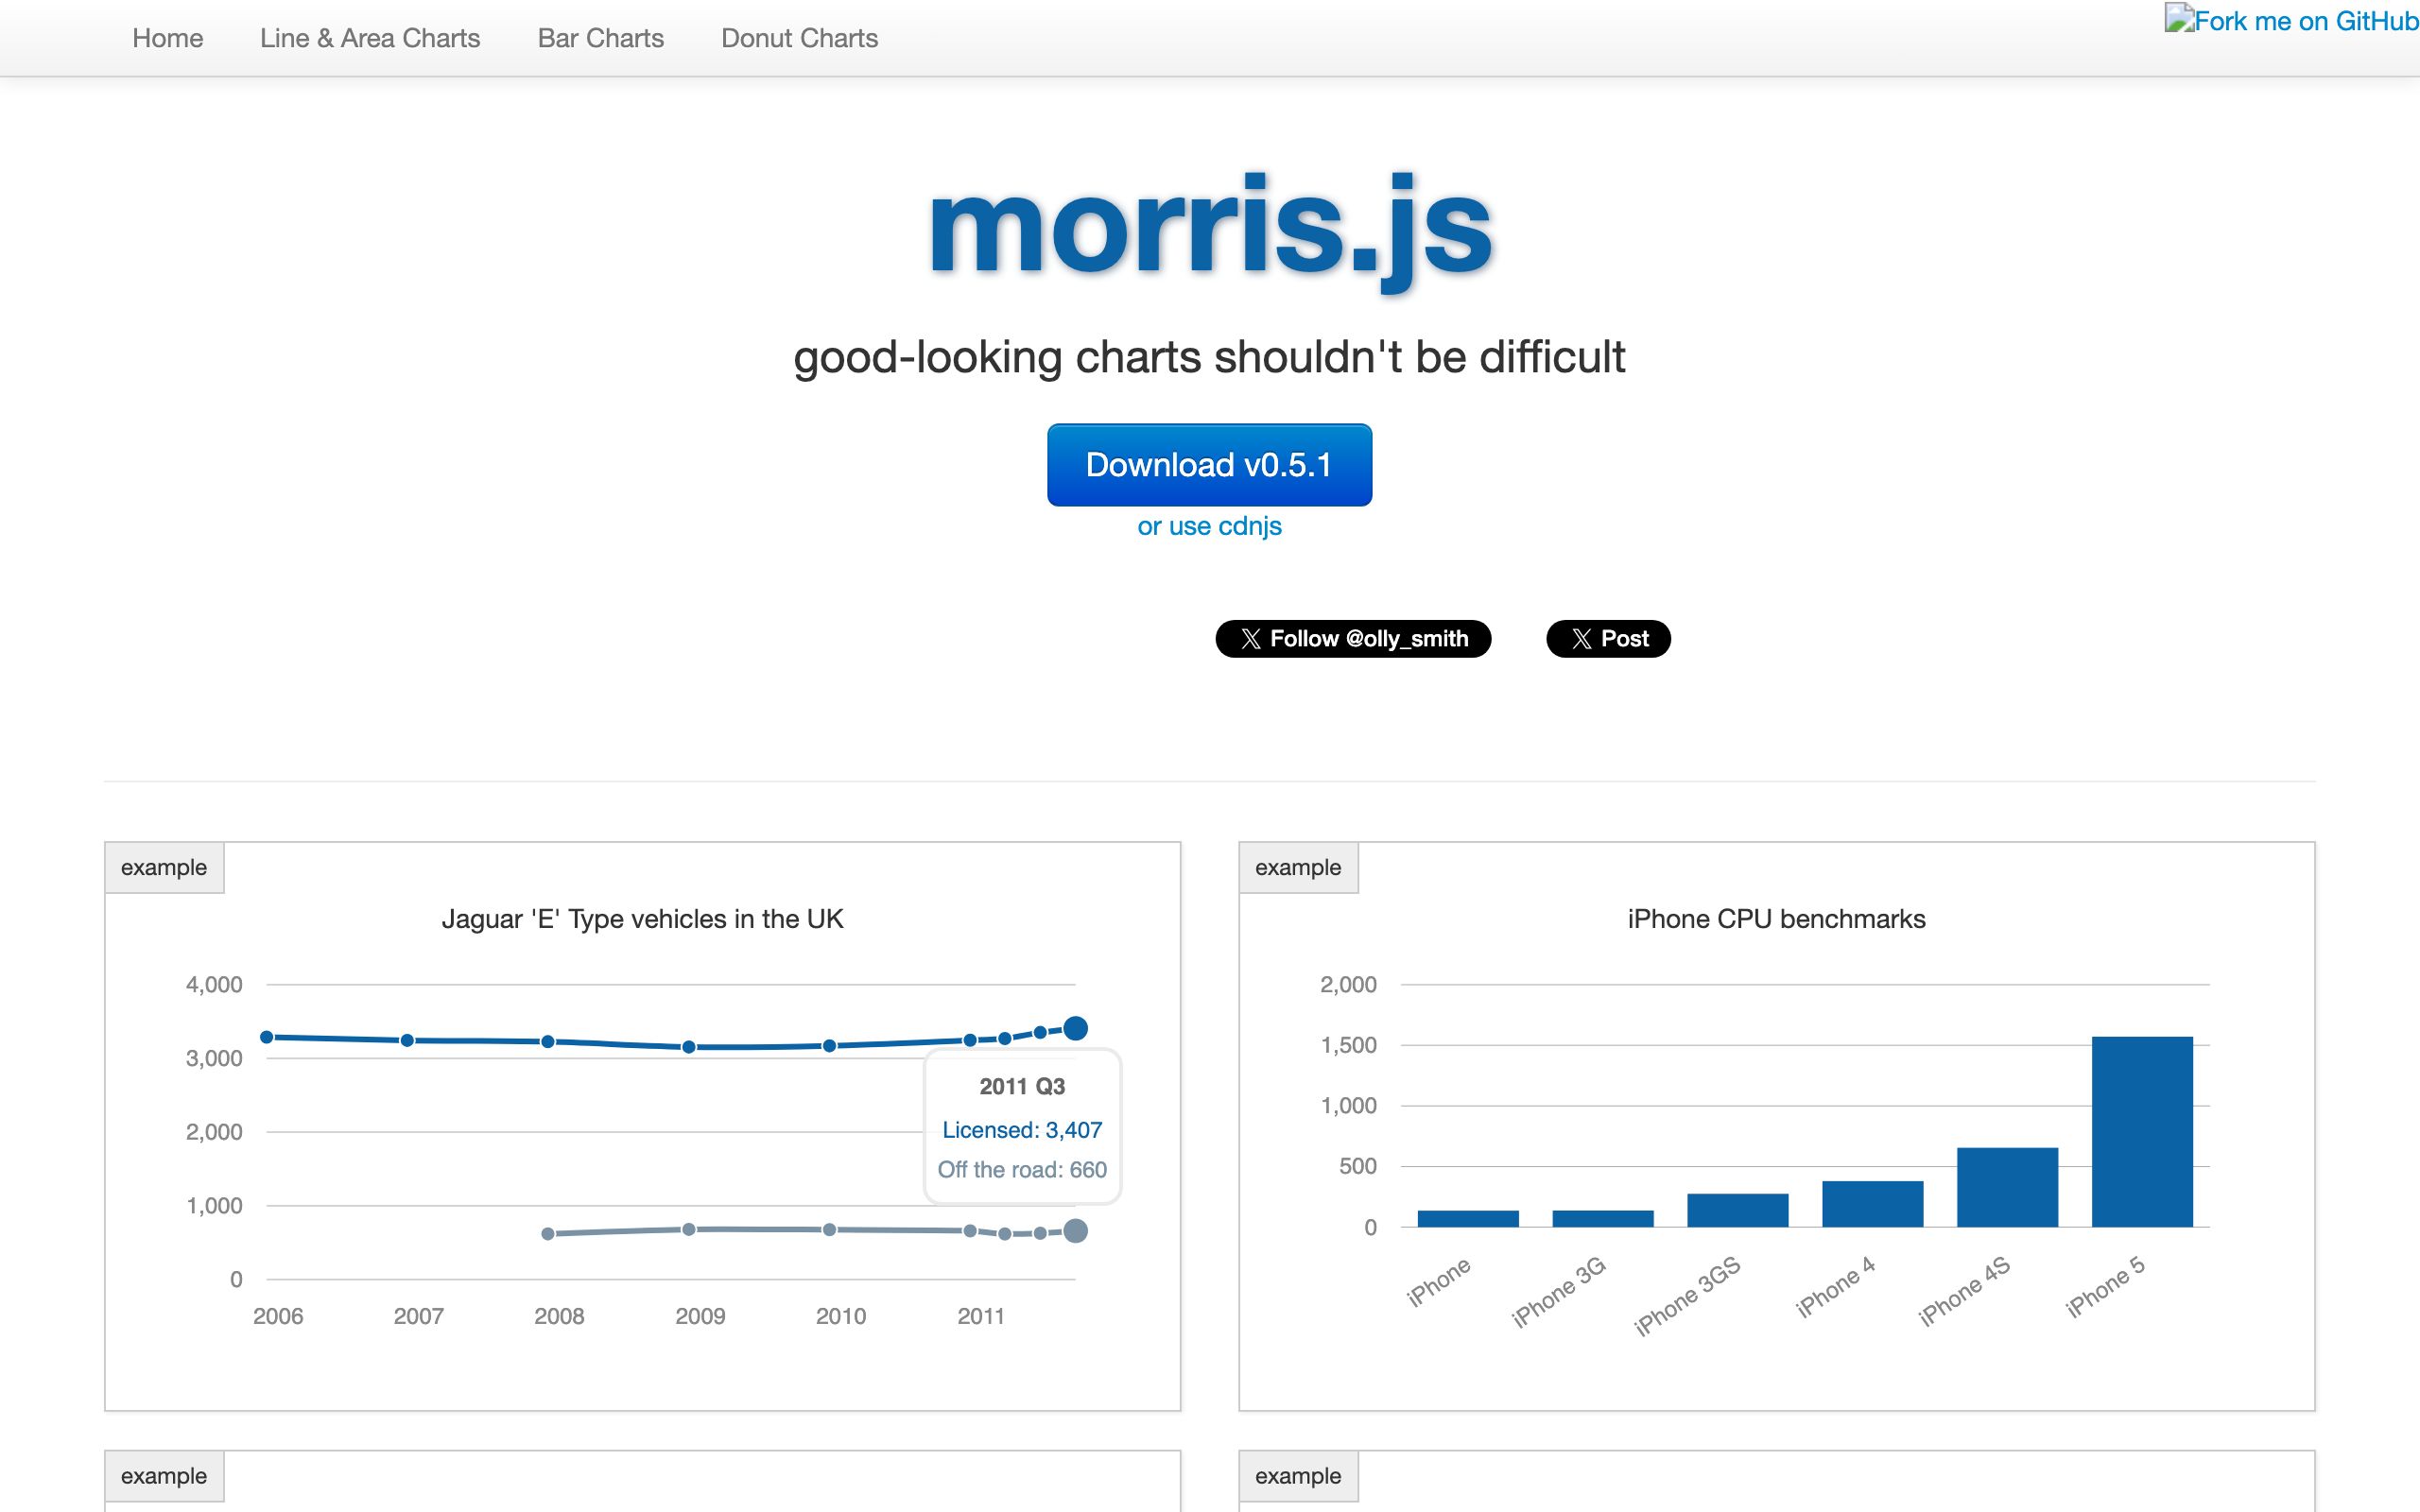
morris.js is a charting library that simplifies the process of rendering time-series data visualizations. It supports line, area, bar, and donut charts. The library relies on jQuery for DOM manipulation and Raphaël for SVG rendering. It is designed for ease of use, allowing developers to generate interactive charts by providing a simple data array and specifying the target element. It is released under the Simplified BSD License.
Checked on Sep 30, 2026.
Alternative resources

Kroki
Unified HTTP API to generate diagrams from textual descriptions supporting multiple diagram libraries and output formats.

Chart.js
A flexible JavaScript charting library for the web that uses HTML5 Canvas for rendering and supports eight different chart types.

Mermaid
An open-source diagramming and charting library that uses text-based definitions and a live editor to render diagrams dynamically.