
Sigma.js
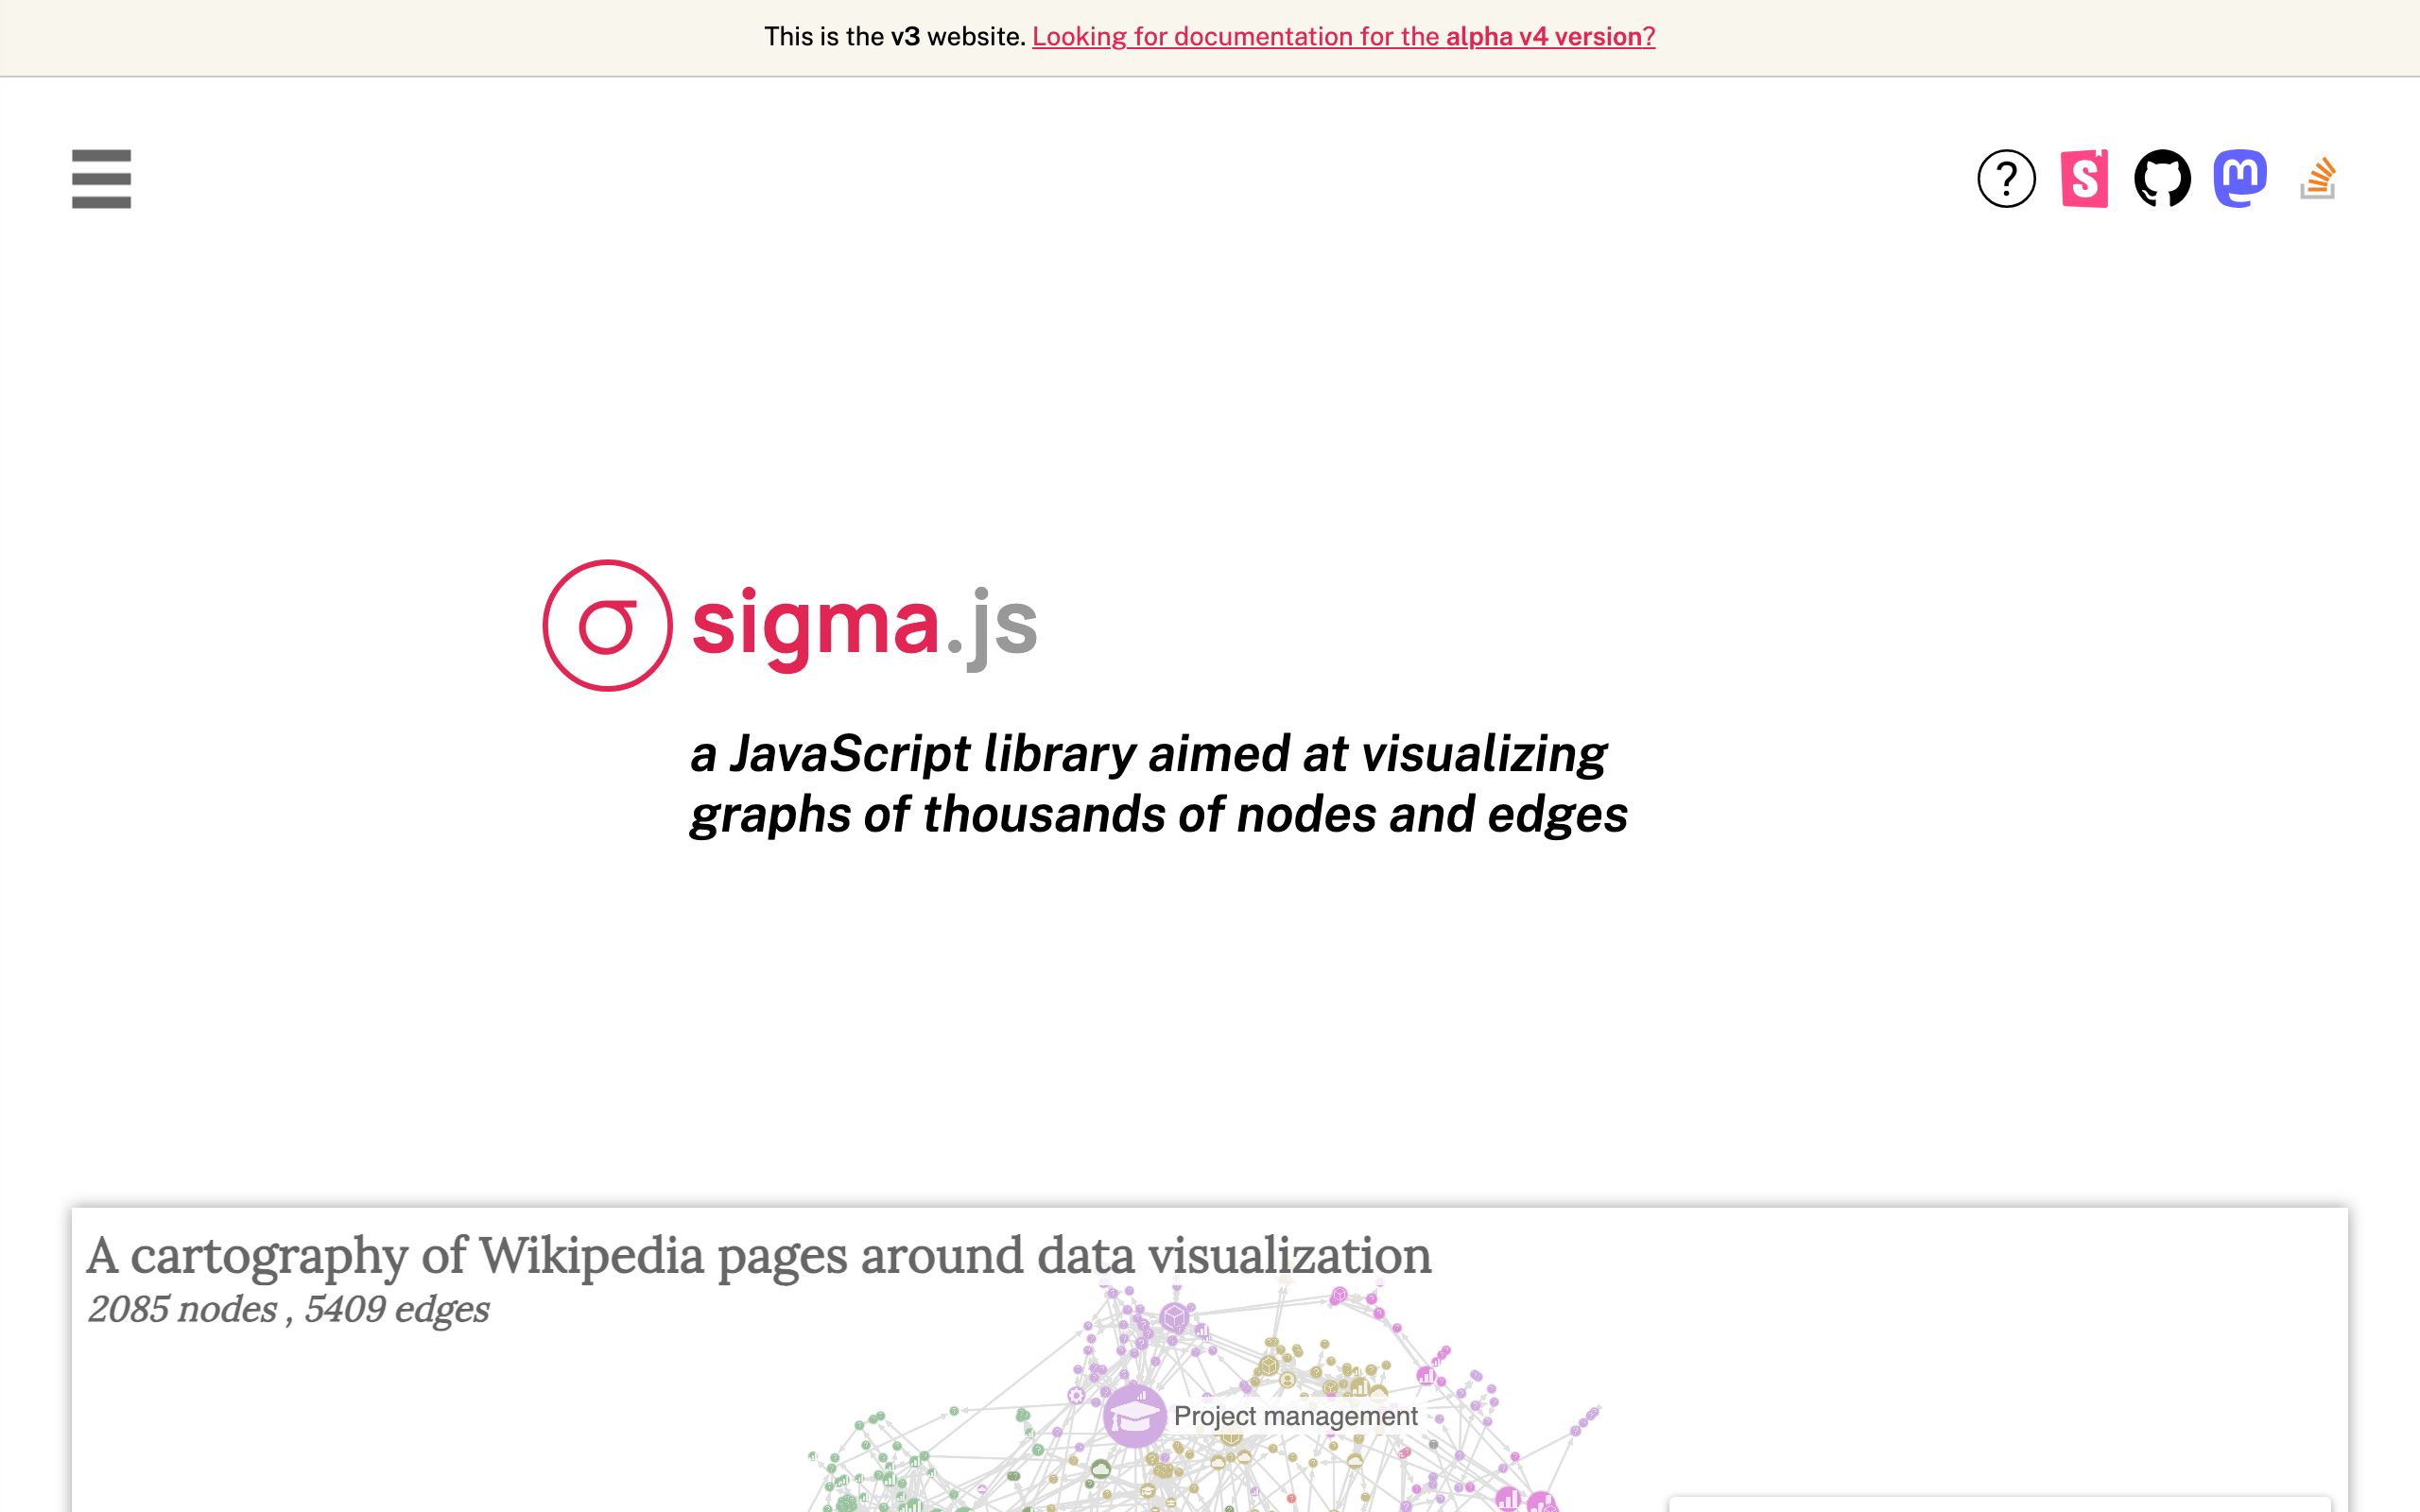
Sigma.js is a dedicated JavaScript library designed specifically for visualizing and interacting with network graphs containing thousands of nodes and edges. It leverages WebGL for high-performance rendering, making it significantly faster for large datasets compared to traditional Canvas or SVG solutions. Operating alongside the graphology data manipulation library, it provides flexible APIs for custom rendering, mouse manipulations, search integration, and neighborhood exploration within web applications.
Checked on Oct 18, 2026.
Alternative resources

Kroki
Unified HTTP API to generate diagrams from textual descriptions supporting multiple diagram libraries and output formats.

Chart.js
A flexible JavaScript charting library for the web that uses HTML5 Canvas for rendering and supports eight different chart types.

Mermaid
An open-source diagramming and charting library that uses text-based definitions and a live editor to render diagrams dynamically.